4/11/2017
Microclimate Survey
Introduction:
The objective of this lab was to become familiar with ArcCollector by conducting a microclimate survey of the campus at the University of Wisconsin Eau Claire. A microclimate survey simply analyzes the different environmental conditions around lower campus. In this instance temperature, wind chill, dew point, wind speed, wind direction, and humidity were measured as climate variables. The survey involved the entire class collecting climate data at once with the use of ArcCollector on the individuals smart phone.
The campus of the University of Wisconsin Eau Claire is fairly diverse with the campus being divided into an upper and lower section (Figure 1). There is also a very heavily forested area and hill dividing upper campus from lower campus. However, the two sections of the campus are fairly homogeneous when compared with themselves. Upper campus is primarily comprised of dormitories, while lower campus is mainly made up of academic halls. Lower campus also extends across the Chippewa River with a walk bridge connecting the two parts of lower campus. This walk bridge is often described as the "coldest place in the lower 48 states", and should present different data than the other parts of campus.The primary goal of the microclimate survey was to investigate and compare the different climatic conditions between the upper and lower campus sections.
There are several advantages of using ArcCollector to gather field data, as well as some disadvantages. One of the primary advantages of using ArcCollector is that it can be installed on anyone's smart phone. The application is also very cheap which adds additional flexibility to ArcCollector. Another advantage of ArcCollector is that multiple people can use the application at once. If an organization needed to collect quantities of broad data all at one time then ArcCollector should be considered as an option. One disadvantage of ArcCollector on a smart phone is that the cell phones built in GPS is not as accurate as a survey grade GPS unit. This adds limitations to the type of projects one may use ArcCollector to perform. If a high grade of GPS accuracy is required for the project then an additional method other than ArcCollector should be utilized.

Figure 1. The campus of the University of Wisconsin Eau Claire. The red lines represent different survey zones. The different regions of the campus are labeled in black.
Methods:
Before the survey took place the project was first deployed to ArcGIS Online and then to ArcCollector. Also, a pre-created geodatabase was entered into ArcCollector. This geodatabase contained the necessary domains and feature classes required for the survey. These steps were performed in ArcGIS Online by logging into the UWEC enterprise account. The project/basemap had to also be shared with other UWEC members to allow for collaboration.Another step the class had to perform before completing the survey involved downloading the ArcCollector application on their smartphones. This would allow the individual to collect and share data with other members of the class. After the survey took place the geodatabase could then be brought into ArcMap, and the data could be analyzed and mapped. Another option was to map the data in ArcGIS Online and then publicly share the maps. This option was not used in this particular project but will be used in the next lab.
The survey methods are below.
First, the campus was divided into different zones to insure the class was evenly distributed throughout campus (Figure 1). Each individual that participated in the survey was assigned a zone and hand held device that could measure temperature, wind chill, dew point, wind speed, and relative humidity. Wind direction was measured with the use of a hand held compass. The individual was to collect data from 20 different locations within their assigned zone (Figure 2).

Figure 2. The location of each survey point collected with the use of ArcCollector. Look to figure 1 for additional reference and comparison.
Results/Discussion:
Maps of temperature and wind speed/direction were generated in ArcMap to represent the different micro climates throughout campus. Temperature was fairly homogeneous throughout campus (Figure 3). However, there were several hot spots located throughout campus. The average temperature on March 29 (survey date) was between 49 and 51 degrees F. This was around ten degrees cooler than the temperature at some of the hot spots. The largest hot spot was located on upper campus near Towers Hall which is a dormitory. These hot spots are created from the warm air leaving certain buildings via exhaust. The exhausted increases the temperature several meters away from the hot spot and dissipates over a relatively small distance.
Wind speed/direction varied throughout campus. There are many factors that could have altered wind speed and direction. One of these factors is the time at which the reading was taken. The wind speed/direction could have easily changed depending on the time. Another factor that can influence wind speed and direction in this case includes the layout of the buildings. The buildings can block and vector the wind. Overall, the greatest wind speeds recorded were on the walk bridge (Figure 4). March 29 was not a particularly windy day with an average wind speed of less than 5 mph. However, on the walk bridge a wind gust of 33 mph was recorded. Other gusts between 5-7 mph were also recorded on the bridge. This is indicative of the un-sheltered nature of the walk bridge. This high amount of wind also contributes to the cold temperatures often felt on the walk bridge.
Wind direction was very heterogeneous throughout campus (Figure 4). This has to do with the layout of the buildings that hinder and vector wind in certain areas. The wind direction on the walk bridge which is in a very high/open area had the wind coming from the South/SouthEast. This is likely indicative of the true wind direction on March 29.
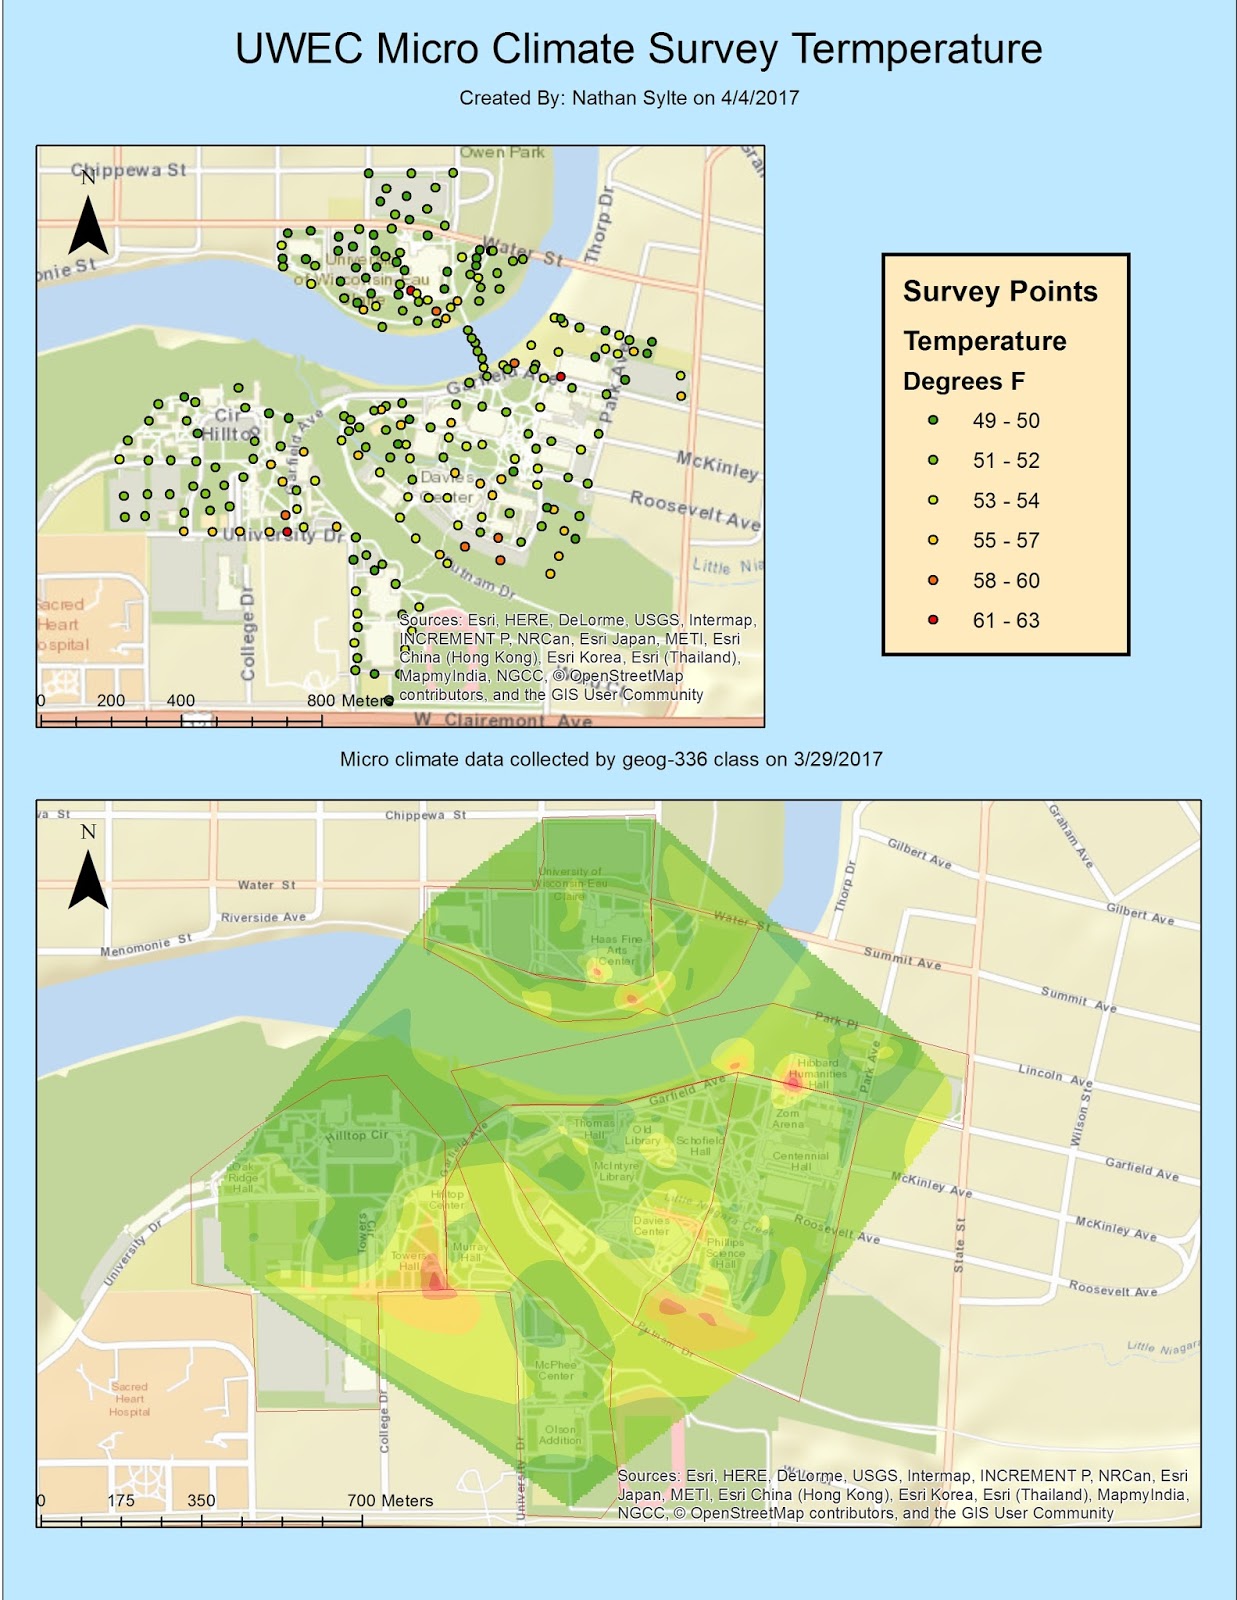
Figure 3. Interpolation map of temperature throughout the UWEC Campus.

Figure 4. Map of wind speed and direction. Wind speed is represented by colored dots with the highest speed shown with the darkest dots. The arrows are pointing in the direction the wind is blowing.
Conclusion:
ArcCollector proved to be a very interesting, flexible, and useful application. For surveys like the microclimate survey ArcCollector should be considered as method and application for collecting data. ArcCollector also demonstrated that a large quantity of participants can all work on collecting data at once, henceforth collecting a large volume of data. The next lab which also involves using ArcCollector should prove to be very interesting and applicable.
No comments:
Post a Comment